2008-12-09
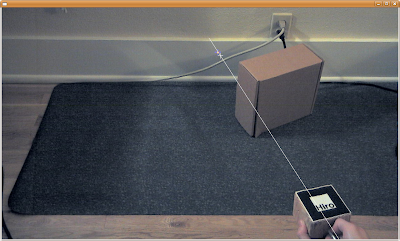
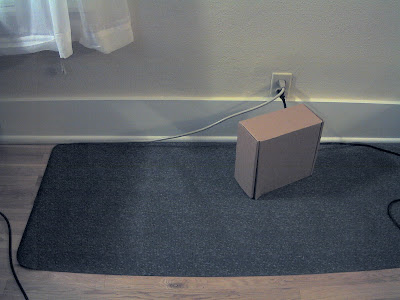
Multicamera Balloon Imagery
AHAB Tether Test from binarymillenium on Vimeo.
I originally was reminded of the unused source images because another team member recently posted some pictures from their camera, and then I made this, and then Bre posted about it, so it's getting a lot of positive feedback.
This video would have been made earlier but I had assumed that the cameras were screwy and firing at different times and image sequences would not line up at all- turns out they did, they just had wildly different start points.
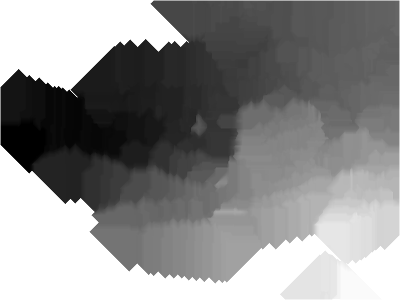
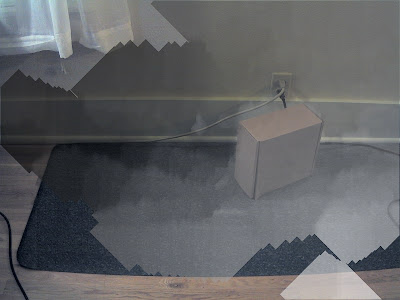
Also I finished this school project that was kind of a simple occupancy grid inspired thing, this video shows parts of it:
2.5D from binarymillenium on Vimeo.
I might revisit some of this and get the registration code working (and working a lot faster), instead of cheating and using the known camera position and attitude.
2008-11-21
Depth buffer to 3d coordinates?
I'm having trouble transforming screen coordinates back to 3d, which this post describes- can anyone help me?


---
Update - I've got it figured out now, I should have been using gluUnProject:
After all that depth d will be linear and in proper world coordinates.


---
Update - I've got it figured out now, I should have been using gluUnProject:
FloatBuffer fb;

fb = BufferUtil.newFloatBuffer(width*height);

gl.glReadPixels(0, 0, width, height, GL.GL_DEPTH_COMPONENT, GL.GL_FLOAT, fb);
fb.rewind();

int viewport[] = new int[4];
double[] proj=new double[16];
double[] model=new double[16];
gl.glGetIntegerv(GL.GL_VIEWPORT, viewport, 0);
gl.glGetDoublev(GL.GL_PROJECTION_MATRIX,proj,0);
gl.glGetDoublev(GL.GL_MODELVIEW_MATRIX,model,0);

...
for(int i...
for (int j...
...
glu.gluUnProject(i,height-j,rawd, model,0,proj,0,viewport,0,pos,0);
float d = (float)-pos[2];
After all that depth d will be linear and in proper world coordinates.
2008-11-20
Artoolkit + rangefinder
Since my relatively inexpensive purely visual depth map approach wasn't that successful, I've tried it out using a rangefinder instead of a visible laser. This means I can point the video camera straight at the marker (which is attached to the rangefinder), and it can point at anything provided I don't tilt it so the camera can't see the marker/fiducial.
This is the result:
Artoolkit with a Rangefinder from binarymillenium on Vimeo.
The following plots show the tracked attitude of the rangefinder as measured by ARToolkit:


My left to right bottom to top scanning approach is very apparent.
And here is the tracked attitude (as a 3-component vector) plus the range vs. time:

You can see how cyclical it is, as I scan the floor in front of me the range doesn't change much until I reach one end and tilt the tripod up a little, and then later on I start to capture the two wheels of the car.
2008-11-09
University of Washington BioRobotics Lab
I took a tour of the UW BioRobotics Lab, where an old professor of mine works on telerobotics with haptic interfaces.
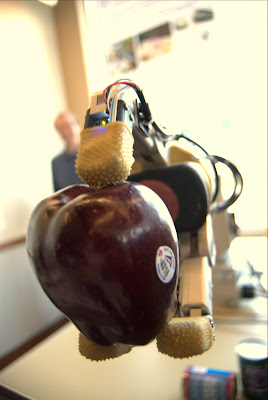
This is a surgery robot called 'The Raven'. It's mostly camouflaged due to the large amounts of detail and contrast in the robot itself and in the background. The DV camera is going to be replaced by a pair of HD cameras that will provide stereo vision.
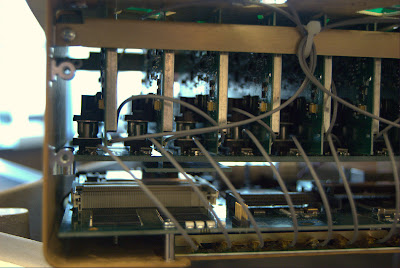
Multiple motors pull on cables seen in a later photo that control the manipulator end of the arm.


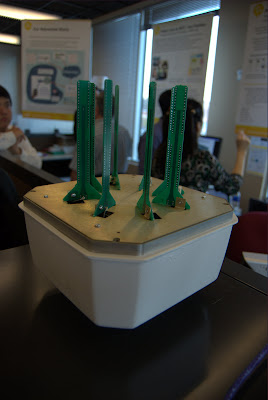
Blake Hannaford shows the arms that will replace the manually positioned arms seen in the previous photos.

 |
This is a surgery robot called 'The Raven'. It's mostly camouflaged due to the large amounts of detail and contrast in the robot itself and in the background. The DV camera is going to be replaced by a pair of HD cameras that will provide stereo vision.
 |
Multiple motors pull on cables seen in a later photo that control the manipulator end of the arm.
 |
Blake Hannaford shows the arms that will replace the manually positioned arms seen in the previous photos.
2008-10-14


2008-10-07
Artoolkit rangefinding continued
I've discovered the arParamObserv2Ideal() function to correct for image distortion, and I think it has improved things. But my main problem is figuring out how to properly project the line from the origin through the laser dot in marker/fiducial space. I have a message out on the mailing list but it is not that active.

The results of my crude fillgaps processing app are shown below, using the somewhat sparse points from above.

The above results look pretty good- the points along the edge of the wall and floor are the furthest from the camera so appear black, and the floor and wall toward the top and bottom of the image are closer and get brighter.
My main problem is getting live feedback of where I've gotten points. With a live view that showed all found depth points it would be easier to achieve uniform coverage, rather than going off of memory. My problem there is that to use artoolkit I have to detect the markers, then shrink the image down and draw dots over it- not too hard sounding but the first time I tried it got all messed up.
2008-10-05
Depth Maps with ARToolkit and a Laser Pointer
Flying home from a recent trip to the east coast, I tried to figure out what the most inexpensive method for approximating scanning lidar would be. This is my answer:
ARToolKit assisted laser rangefinding from binarymillenium on Vimeo.
It's not that inexpensive, since I'm using a high resolution network camera similar to an Elphel- but it's possible I could replace it with a good consumer still camera with a linux supported usb interface for getting live images.
In the above screen shot the line projected from the found fiducial is shown, and the target where the found red laser dot is- they ought to cross each other but I need to learn more about transforming coordinates in and out of the camera space in ARToolkit to improve upon it.
This picture shows that the left side of the screen is 'further' away than the wall on the right, but that is not quite right- it is definitely further away from the fiducial, so I may be making an error.
source code
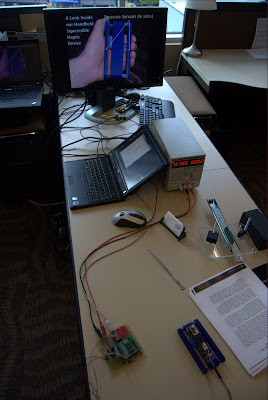
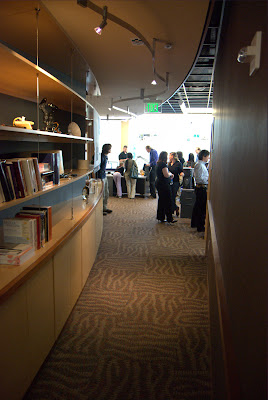
Intel Research Seattle - Open House
 |
| From 2008.10.01 Intel Research Seattle |
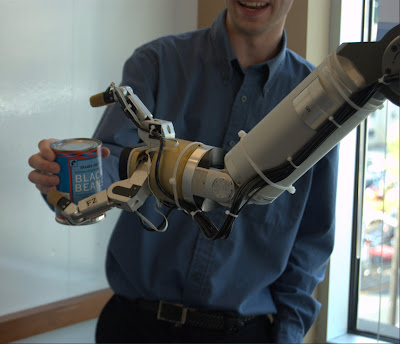
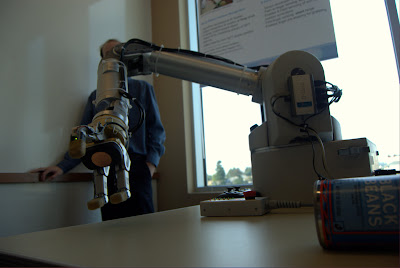
Robotic Arm
 |
| From 2008.10.01 Intel Research Seattle |
 |
| From 2008.10.01 Intel Research Seattle |
This robot had a camera and em field sensors in its hand, and could detect the presence of an object within grasping distant. Some objects it had been trained to recognize, and others it did not but would attempt to grab anyway. Voice synthesis provided additional feedback- most humorously when it accidently (?) dropped something it said 'oops'. Also motor feedback sensed when the arm was pushed on, and the arm would give way- making it much safer than an arm that would blindly power through any obstacle.
 |
| From 2008.10.01 Intel Research Seattle |
 |
| From 2008.10.01 Intel Research Seattle |
It's insane, this application level taint
 |
| From 2008.10.01 Intel Research Seattle |
I don't really know what this is about...
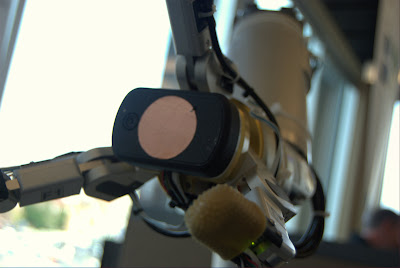
Directional phased array wireless networking
 |
| From 2008.10.01 Intel Research Seattle |
The phased array part is pretty cool, but the application wasn't that compelling: Using two directional antennas a select zone can be provided with wireless access and other zones not overlapped by the two excluded. Maybe if it's more power efficient that way?
 |
| From 2008.10.01 Intel Research Seattle |
 |
| From 2008.10.01 Intel Research Seattle |
This antenna also had a motorized base, so that comparisons between physically rotating the antenna and rotating the field pattern could be made.
Haptic squeeze
 |
| From 2008.10.01 Intel Research Seattle |
This squeeze thing has a motor in it to resist pressure, but was broken at the time I saw it. The presenter said it wasn't really intended to simulate handling of real objects in virtual space like other haptic interfaces might, but be used more abstractly as a interface to anything.
 |
| From 2008.10.01 Intel Research Seattle |
RFID Accelerometer
 |
| From 2008.10.01 Intel Research Seattle |
 |
| From 2008.10.01 Intel Research Seattle |
This was one of two rfid accelerometers- powered entirely from the rfid antenna, the device sends back accelerometer data to rotate a planet on a computer screen. The range was very limited, and the update rate about 10 Hz. The second device could be charged within range of the field, then be taken out of range and moved around, then brought back to the antenna and download a time history (only 2 Hz now) of measurements taken. The canonical application is putting the device in a shipped package and then reading what it experienced upon receipt.
Wireless Resonant Energy
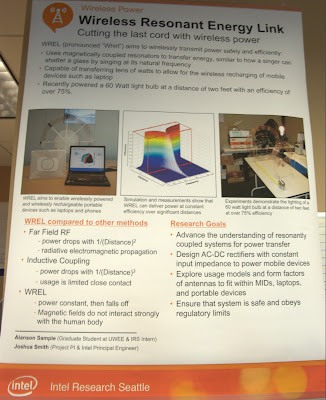 |
| From 2008.10.01 Intel Research Seattle |
 |
| From 2008.10.01 Intel Research Seattle |
This has had plenty of coverage elsewhere but is very cool to see in person. Currently moving the receiver end more than an inch forward or back or rotating it causes the light buld to dim and go out.
Scratch Interface
 |
| From 2008.10.01 Intel Research Seattle |
A simple interface where placing a microphone on a surface and then tapping on the surface in distinct ways can be used to control a device. Also a very simple demo of using opencv face tracking to reorient a displayed video to correct for distortion seen when viewing a flat screen from an angle.
Look around the building
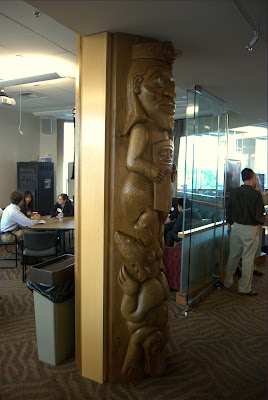 |
| From 2008.10.01 Intel Research Seattle |
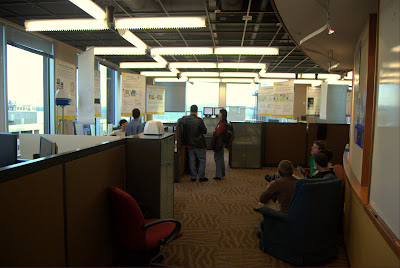 |
| From 2008.10.01 Intel Research Seattle |
 |
| From 2008.10.01 Intel Research Seattle |
I found myself walking in a circle and not quite intuitively feeling I had completed a circuit when I actually had.
Also see another article about this, and Intel's flickr photos, and a a video.
2008-09-26
initialization discards qualifiers from pointer target type
A const may be needed, the following produces the error:
while this fixes it:
In other news hopefully soon I'll have an ARToolkit app for reading in jpegs using ImageMagick, and also that app will have some other more exciting attributes.
PixelPacket *p = AcquireImagePixels(image,0,y,image->columns,1,&image->exception);
while this fixes it:
const PixelPacket *p = AcquireImagePixels(image,0,y,image->columns,1,&image->exception);
In other news hopefully soon I'll have an ARToolkit app for reading in jpegs using ImageMagick, and also that app will have some other more exciting attributes.
2008-09-08
Increased Dynamic Range For Depth Maps, and Collages in Picasa 3
360 Vision + 3rd Person Composite from binarymillenium on Vimeo.
After I compressed the above video into a WMV I was dissatisfied with how little depth detail there is in the 360 degree vision part - it's the top strip. I initially liked the cleaner single shade look, but now I realize the utility of using a range of colors for depth fields (or IR/thermal imaging also)- it increases the number of colors to represent different depths beyond 256 to a larger number. Earlier I tried using one color channel for higher order bits and another for lower order bits (so the depth could be computed like red*256+green) for a total of 256*256 depth levels (or even 256^3 or 256^4 using alpha), but visually it's a mess.
But visual integrity can be maintained while multiplying that 256 levels by five or a bit more with additional work.
Taking six colors, three of them are pure red, green, blue, and inbetween there is (255,255,0) for yellow and the other two pure combinations of two channels. Between each subsequent set there can be 256 interpolated values, and in the end a color bar like the follow is generated with 1280 different values:

The bottom color bar shows the differences between adjacent values- if the difference was none then it would be black in spots, so my interpolation is verified.
Applying this to the lidar data, I produced a series of images with a processing project:

After making all the images I tried out Picasa 3 to produce a collage- the straightforward grid makes the most sense here. Picasa 3 crashed a few times in the collage editor before I was able to get this exported.
2008-08-31
Photosynth Export Process Tutorial
It looks like I have unofficial recognition/support for my export process, but I get the feeling it's still too user unfriendly:
http://getsatisfaction.com/livelabs/topics/pointcloud_exporter
What to do
Get Wireshark http://www.wireshark.org/
Allow it to install the special software to intercept packets.
Start Wireshark. Put
into the filter field.
Quit any unnecessary network activity like playing youtube videos- this will dump in a lot of data to wireshark that will making finding the bin files harder.
*** Update ***
Some users have found the bin files stored locally in %temp%/photosynther, which makes finding them much easier than using Wireshark, but the for me on Vista the directory exists for one user but not others- but the bin files have to be stored locally somewhere right?
***
Open the photosynth site in a browser. Find a synth with a good point cloud, it will probably be one with several hundred photos and a synthiness of > 70%. There are some synths that are 100% synthy but have point clouds that are flat billboards rather than cool 3D features- you don't want those. Press p or hold ctrl to see the underlying point cloud.
*** Update ***
Use the direct 3d viewer option to view the synth, otherwise you won't get the synth files. (thanks losap)
***
Start a capture in Wireshark - the upper left butter and then click the proper interface (experiment if necessary).
Hit reload on the browser window showing the synth. Wireshark should then start show ing what files are being sent to your computer. Stop the capture once the browser has finished reloading. There may be a couple screen fulls but near the bottom should be a few listings of bin files.
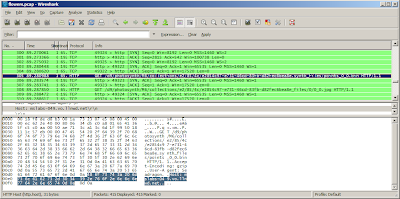
Select one of the lines that shows a bin file request, and right-click and hit Copy | Summary (text). Then in a new browser window paste that into the address field. Delete the parts before and after /d8/348345348.../points_0_0.bin. Look back in Wireshark to discover what http address to use prior the that- it should be http://mslabs-nnn.vo.llnwd.net, but where nnn is any three digit number. TBD- is there a way to cut and paste the fully formed url less manually?
If done correctly hit return and make the browser load the file- a dialog will pop up, save it to disk. If there were many points bin files increment the 0 in the file name and get them all. If you have cygwin a bash script works well:
Python
Install python. If you have cygwin installed the cygwin python with setup.exe, otherwise http://www.python.org/download/ and download the windows installer version.
*** UPDATE *** It appears the 2.5.2 windows python doesn't work correctly, which I'll look into- the best solution is to use Linux or Cygwin with the python that can be installed with Linux ***
Currently the script http://binarymillenium.googlecode.com/svn/trunk/processing/psynth/bin_to_csv.py works like this from the command line:
But I think the '>' will only work with cygwin and not the windows command prompt. I'll update the script to optionally take a second argument that is the output file.
If there are multiple points bin files it's easy to do another bash loop to process them all in a row, otherwise manually do the command above and create n different csvs for n bin files, and then cut and paste the contents of each into one complete csv file.
The output will be file with a long listing of numbers, each one looks like this:
The first three numbers are the xyz coordinates of a point, and the last three is the red, green, and blue components of the color. In order to get a convention 0-255 number for each color channel red and blue would have to be multiplied by 8, and green by 4. The python script could be easily changed to do that, or even convert the color channels to 0.0-1.0 floating point numbers.
Point Clouds - What Next?
The processing files here can use the point clouds:
http://binarymillenium.googlecode.com/svn/trunk/processing/psynth/
Also programs like Meshlab can use them with some modification- I haven't experimented with it much but I'll look into that and make a post about it.
http://getsatisfaction.com/livelabs/topics/pointcloud_exporter
What to do
Get Wireshark http://www.wireshark.org/
Allow it to install the special software to intercept packets.
Start Wireshark. Put
http.request
into the filter field.
Quit any unnecessary network activity like playing youtube videos- this will dump in a lot of data to wireshark that will making finding the bin files harder.
*** Update ***
Some users have found the bin files stored locally in %temp%/photosynther, which makes finding them much easier than using Wireshark, but the for me on Vista the directory exists for one user but not others- but the bin files have to be stored locally somewhere right?
***
Open the photosynth site in a browser. Find a synth with a good point cloud, it will probably be one with several hundred photos and a synthiness of > 70%. There are some synths that are 100% synthy but have point clouds that are flat billboards rather than cool 3D features- you don't want those. Press p or hold ctrl to see the underlying point cloud.
*** Update ***
Use the direct 3d viewer option to view the synth, otherwise you won't get the synth files. (thanks losap)
***
Start a capture in Wireshark - the upper left butter and then click the proper interface (experiment if necessary).
Hit reload on the browser window showing the synth. Wireshark should then start show ing what files are being sent to your computer. Stop the capture once the browser has finished reloading. There may be a couple screen fulls but near the bottom should be a few listings of bin files.

Select one of the lines that shows a bin file request, and right-click and hit Copy | Summary (text). Then in a new browser window paste that into the address field. Delete the parts before and after /d8/348345348.../points_0_0.bin. Look back in Wireshark to discover what http address to use prior the that- it should be http://mslabs-nnn.vo.llnwd.net, but where nnn is any three digit number. TBD- is there a way to cut and paste the fully formed url less manually?
If done correctly hit return and make the browser load the file- a dialog will pop up, save it to disk. If there were many points bin files increment the 0 in the file name and get them all. If you have cygwin a bash script works well:
for i in `seq 0 23`
do
wget http://someurl/points_0_$i.bin
done
Python
Install python. If you have cygwin installed the cygwin python with setup.exe, otherwise http://www.python.org/download/ and download the windows installer version.
*** UPDATE *** It appears the 2.5.2 windows python doesn't work correctly, which I'll look into- the best solution is to use Linux or Cygwin with the python that can be installed with Linux ***
Currently the script http://binarymillenium.googlecode.com/svn/trunk/processing/psynth/bin_to_csv.py works like this from the command line:
python bin_to_csv.py somefile.bin > output.csv
But I think the '>' will only work with cygwin and not the windows command prompt. I'll update the script to optionally take a second argument that is the output file.
If there are multiple points bin files it's easy to do another bash loop to process them all in a row, otherwise manually do the command above and create n different csvs for n bin files, and then cut and paste the contents of each into one complete csv file.
The output will be file with a long listing of numbers, each one looks like this:
-4.17390823, -1.38746762, 0.832364499, 24, 21, 16
-4.07660007, -1.83771312, 1.971277475, 17, 14, 9
-4.13320493, -2.56310105, 2.301105737, 10, 6, 0
-2.97198987, -1.44950056, 0.194522276, 15, 12, 8
-2.96658635, -1.45545017, 0.181564241, 15, 13, 10
-4.20609378, -2.08472299, 1.701148629, 25, 22, 18
The first three numbers are the xyz coordinates of a point, and the last three is the red, green, and blue components of the color. In order to get a convention 0-255 number for each color channel red and blue would have to be multiplied by 8, and green by 4. The python script could be easily changed to do that, or even convert the color channels to 0.0-1.0 floating point numbers.
Point Clouds - What Next?
The processing files here can use the point clouds:
http://binarymillenium.googlecode.com/svn/trunk/processing/psynth/
Also programs like Meshlab can use them with some modification- I haven't experimented with it much but I'll look into that and make a post about it.
2008-08-28
Color Correction

I have the colors figured out now: I was forgetting to byteswap the two color bytes, and after that the rgb elements line up nicely. And it's 5:6:5 bits per color channel rather than 4 as I thought previously, thanks to Marvin who commented below.
The sphinx above looks right, but earlier the boxer shown below looked so wrong I colored it falsely to make the video:
The Boxer - Photosynth Export from binarymillenium on Vimeo.
But I've fixed the boxer now:

The python script is updated with this code:
  bin.byteswap()
  red =  (bin[0] >> 11) & 0x1f
  green = (bin[0] >> 5)  & 0x3f
  blue =  (bin[0] >> 0)  & 0x1f
2008-08-27
Exporting Point Clouds From Photosynth

Since my last post about photosynth I've revisited the site and discovered that the pictures can be toggled off with the 'p' key, and the viewing experience is much improved given there is a good point cloud underneath. But what use is a point cloud inside a browser window if it can't be exported to be manipulated into random videos that could look like all the lidar videos I've made, or turned into 3D meshes and used in Maya or any other program?
Supposedly export will be added in the future, but I'm impatient like one of the posters on that thread so I've gone forward and figured out my own export method without any deep hacking that might violate the terms of use.
Using one of those programs to intercept 3D api calls might work, though maybe not with DirectX or however the photosynth browser window is working. What I found with Wireshark is that http requests for a series of points_m_n.bin files are made. The m is the group number, if the photosynth is 100% synthy then there will only be one group labeled 0. The n splits up the point cloud into smaller files, for a small synth there could just be points_0_0.bin.
Inside each bin file is raw binary data. There is a variable length header which I have no idea how to interpret, sometimes it is 15 bytes long and sometimes hundreds or thousands of bytes long (though it seems to be shorter in smaller synths).
But after the header there is a regular set of position and color values each 14 bytes long. The first 3 sets of 4 bytes are the xyz position in floating point values. In python I had to do a byteswap on those bytes (presumably from network order) to get them to be read in right with the readfile command.
The last 2 bytes is the color of the point. It's only 4-bits per color channel, which is strange. The first four bits I don't know about, the last three sets of 4 bits are red, blue, and green. Why not 8-bits per channel, does the photosynth process not produce that level of precision because it is only loosely matching the color of corresponding points in photos? Anyway as the picture above shows I'm doing the color wrong- if I have a pure red or green synth it looks right, but maybe a different color model than standard rgb is at work.
I tried making a photosynth of photos that were masked to be blue only- and zero synthiness resulted - is it ignoring blue because it doesn't want to synth up the sky in photos?
Anyway here is the python script for interpreting the bin files.
The sceneviewer (taken from the Radiohead sceneviewer) in that source dir works well for displaying them also.
Anyway to repeat this for any synth wireshark needs to figure out where the bin files are served from (filter with http.request), and then they can be downloaded in firefox or with wget or curl, and then my script can be run on them, and processing can view them. The TOC doesn't clearly specify how the point clouds are covered so redistribution of point clouds, especially those not from your own synths or someone who didn't CC license it, may not be kosher.
2008-08-24
More python pcap with pcapy
After running into pcap files several hundreds of megabytes in size that caused wireshark to crash when loaded, I returned to trying to make python work with the source pcap file:
What is a Reader object, and a built-in method of it? Why are the addresses the same?
try
So that's just the problem I was running into before: '\xff' is an ascii representation of binary data that's really 0xff. But I'm given it in ascii- I can't index into this and get a specific 8-bit 0-255 binary value, I get a '\'. Do I have to write something that goes through this and reinterpets the ascii-ized hex back into real hex?
Also I note the ff dd that marks the beginning of the data frame is there but not at the beginning- so there are other parts of the packet here I need to get rid of. Is this where I need Impacket?
import impacket
from impacket.ImpactDecoder import EthDecoder
oops
The decode makes a nice human readable text of the packet, but not what I want.
Here is a different tack- by looking in the Impacket.py source I found how to do this which converts that annoying ascii back to real bytes, which is the only real issue:
mybytes is of size 1248, so there appear to be 42 extra bytes of unwanted ethernet wrapper there- why not just index into mbytes like mybytes[42:] and dump that to a binary file?
I don't know about the dumping to binary file (print mybytes prints it in ascii, not binary)- but I could easily pass that array straight into the velodyne parsing code- and this skips the intermediate file step, saving time and precious room on my always nearly full laptop hd.
So here is the final result, which produce good CSVs I was able to load with my 'velosphere' Processing project to create 360 degree panoramas from the lidar data:
Next I need a way to write pngs from python, and I could eliminate the CSVs & Processing step.
import pcapy

vel = pcapy.open_offline('unit 46 sample capture velodyne area.pcap')

vel
Reader object at 0xb7e1b308

pkt = vel.next

pkt
built-in method next of Reader object at 0xb7e1b308
What is a Reader object, and a built-in method of it? Why are the addresses the same?
try
pkt = vel.next()

type(vel)
type 'tuple'

vel[1]


'\xff\xff\xff\xff\xff\xff\x00\x00\x00\x00\x00\x00\x08\x00E\x00\x04\xd2
\x00\x01\x00\x00\x80\x11\xad\x9f\xc0\xa8\x03+\xc0\xa8\x03\xff\x01\xbb
\t@\x04\xbe\x00\x00\xff\xddz\x13\xee
...
\x00\x00\x10\xd63Md\xc2\xff\x00\x00\x0fp\x07v25b'
So that's just the problem I was running into before: '\xff' is an ascii representation of binary data that's really 0xff. But I'm given it in ascii- I can't index into this and get a specific 8-bit 0-255 binary value, I get a '\'. Do I have to write something that goes through this and reinterpets the ascii-ized hex back into real hex?
Also I note the ff dd that marks the beginning of the data frame is there but not at the beginning- so there are other parts of the packet here I need to get rid of. Is this where I need Impacket?
import impacket
from impacket.ImpactDecoder import EthDecoder
decoder = EthDecoder()
b = decoder.decode(a)
Traceback (most recent call last):
File "stdin", line 1, in ?
File "/var/lib/python-support/python2.4/impacket/ImpactDecoder.py", line 38, in decode
  e = ImpactPacket.Ethernet(aBuffer)
File "/var/lib/python-support/python2.4/impacket/ImpactPacket.py", line 340, in __init__
  self.load_header(aBuffer)
File "/var/lib/python-support/python2.4/impacket/ImpactPacket.py", line 255, in load_header
  self.set_bytes_from_string(aBuffer)
File "/var/lib/python-support/python2.4/impacket/ImpactPacket.py", line 59, in set_bytes_from_string
  self.__bytes = array.array('B', data)
TypeError: an integer is required
oops
b = decoder.decode(a[1])
print b
Ether: 0:0:0:0:0:0 -> ff:ff:ff:ff:ff:ff
IP 192.168.3.43 -> 192.168.3.255
UDP 443 -> 2368

ffdd 7a13 ee09 3cbe 093f 1811 2b1f 1020    ..z.....?..+..
0a0a 63ac 0848 d708 53ea 085b 0000 1bc0    ..c..H..S..[....
0a35 0c09 425b 0936 000d 2e44 0d2f 120b    .5..B[.6...D./..
4f5e 0b30 200f 3c4e 0e50 c30b 46c7 0b4d    O^.0 .
The decode makes a nice human readable text of the packet, but not what I want.
Here is a different tack- by looking in the Impacket.py source I found how to do this which converts that annoying ascii back to real bytes, which is the only real issue:
mybytes = array.array('B', vel[1])
mybytes is of size 1248, so there appear to be 42 extra bytes of unwanted ethernet wrapper there- why not just index into mbytes like mybytes[42:] and dump that to a binary file?
I don't know about the dumping to binary file (print mybytes prints it in ascii, not binary)- but I could easily pass that array straight into the velodyne parsing code- and this skips the intermediate file step, saving time and precious room on my always nearly full laptop hd.
So here is the final result, which produce good CSVs I was able to load with my 'velosphere' Processing project to create 360 degree panoramas from the lidar data:
Next I need a way to write pngs from python, and I could eliminate the CSVs & Processing step.
2008-08-23
Photosynth
When I first saw the original demo I was really impressed, but now that is been released I feel like it hasn't advanced enough since that demo to really be useful. I tried a few random synths when the server was having problems, it looks like it isn't being hammered any longer so I ought to try it again soon when I'm using a compatible OS.
Overall it's confused and muddled to use and look at- like a broken quicktime VR.
Photosynth seems to work best in terms of interface and experience when it is simply a panoramic viewer of stitched together images- where all the images are taken from a point of buildings or scenery around the viewer. It's easy to click left or right to rotate left or right and have the view intuitively change. But we've had photostitching software that produces smooth panoramas that look better than this for years, so there's nothing to offer here.
When viewing more complicated synths, the UI really breaks down. I don't understand why when I click and drag the mouse the view rotates to where I'd like, but then it snaps back to where it used to be when I let go of the button. It's very hard to move naturally through 3D space- I think the main problem is that the program is too photo-centric: it always wants to feature a single photograph prominently rather than a more synthetic view. Why can't I pull back to view all the photos, or at least a jumble of outlines of all the photos?
It seems like there is an interesting 3D point cloud of points found to be common to multiple photos underlying the synth but it can't be viewed on it's own (much less downloaded...), there are always photos obscuring it. The photograph prominence is constantly causing nearby photos to become blurry or transparent in visually disruptive ways.
Finally, it seems like the natural end-point of technology like this is to generate 3D textured models of a location, with viewing of the source photos as a feature but not the most prominent mode. Can this be done with photosynth-like technology or is all the aspects I don't like a way of covering up that it can't actually do that? Maybe it can produce 3D models but they all come out horribly distorted (so then provide a UI to manually undistort them).
Hopefully they will improve on this, or another well-backed site will deliver fully on the promise shown here.
2008-08-20
Makeavi

Discovered a neat windows (and vista) tool for turning image sequences into videos: http://makeavi.sourceforge.net/
1280x720 in the 'Microsoft Video 1' format worked well, though 57 MB of pngs turned into 135 MB of video. 'Uncompressed' didn't produce a video just a small 23kb file. 'Intel IYUV' sort of produced a video but not correctly. 'Cinepak' only output a single frame. 'VP60 Simple profile' and 'VP61 Advanced Profile' with the default settings worked, and actually produces video smaller than the source images, though quicktime player didn't like those files. Vimeo seems to think VP61 is okay:
More Velodyne Lidar - overhead view from binarymillenium on Vimeo.
This new video is similar to the animated gifs I was producing earlier, but using a new set of data. Vimeo seems to be acting up this morning, I got 75% through an upload of the entire file (the above is just a subset) and it locked up. I may try to produce a shorter test video to see if it works.
I have around 10 gigs of lidar data from Velodyne, and of course no way to host it.
My process for taking pcap files and exporting the raw data has run into a hitch- wireshark crashes when trying to 'follow udp stream' for pcap files larger than a couple hundred megabytes. Maybe there is another tool that can do the conversion to raw?
2008-08-14
Phase Correlation for Lidar Image Alignment

After going through the manual alignment of the point cloud data noted in the last post, I've gotten the translation step of automatic alignment using phase correlation.
Phase correlation requires the use of a 2d fft, which I couldn't find in Processing (would have to bring in a java lib for that somehow?). Instead I used Octave, which has the fft2, inverse ifft2 function, and many other convenient math functions. The Matlab/Octave file is here.
The fundamental phase correlation code is this:
a = imread('one.png')
b = imread('two.png')

af = fft2(a);
bf = fft2(b);

% cross power
cp = af.*conj(bf) ./ abs(af.*conj(bf));

icp = (ifft2(cp));

mmax = max(max(icp));
[sx,sy,v] = find(mmax == icp);
And sx and sy are the translation to apply to b to make it line up with image a. An additional check is to make sure the largest value in icp is above some threshold- if it is lower than the threshold then there is no good translation to align the data.
I'm a little suspicious that my input pngs are too regular and easy, every frame seems a constant displacement from the former as the vehicle with the lidar was moving at a constant velocity.
Rotation is mostly working in isolation but I need to revisit the proper method to make simultaneous rotation and translation work- there was a paper somewhere I need to dig up.
2008-08-11
Point Cloud Alignment

I took about 1/5th of the png images generated from the Velodyne point cloud data and manually aligned them in Gimp. It's easy to shift-select a bunch of images and open them as individual layers in Gimp, but there are no multiple layer selection capabilities: it's not possible for instance select all the layers and change their transparency.
In all of the images there are a few features, mostly beyond the edges of the road, that can be aligned with the earlier and later images. The closer together the images are in time the easier this is, but I was skipping every 4 images to take the 5th in order to speed up the process- also a gimp image with 300 layers is difficult to handle.
The later portions of the data are all purely translational, only at the very beginning are rotations and translations needed.
I think an automatic process for alignment won't be that hard, but the inherent inconsistency in frame to frame image will make for a lot of error. Translations correspond to phase shifts in the frequency domain, and I think rotations are almost as simple- and there isn't any scaling to account for.
Subscribe to:
Posts (Atom)